Descriptive vs Predictive vs Prescriptive Analytics: A Practical Guide for Business Teams
Descriptive vs Predictive vs Prescriptive Analytics: A Practical Guide for Business Teams
It is Monday morning. Your retention rate dropped 5 points last week. Your manager asks:
“Should we panic or stay the course?”
You open your dashboards. They show exactly what happened, sliced every possible way. Yet you still do not know what to do next.
That gap is not about having more data. It is about using the right type of analytics for the decision in front of you.
Some frameworks talk about four types of analytics: descriptive, diagnostic, predictive and prescriptive. Descriptive answers “what happened”, diagnostic goes deeper into “why it happened”, predictive looks at “what is likely to happen next” and prescriptive focuses on “what we should do now” .
In practice, diagnostic analytics almost always sits directly on top of descriptive analytics. You start with “what happened”, then slice, drill down and segment to understand “why”. Most business teams treat this whole block as their descriptive layer. That is the view we follow in this guide: diagnostic work is the deeper, investigative side of descriptive analytics, not a completely separate category.
We will focus on three working levels you can actively use in product, growth, marketing, sales and revenue teams:
- Descriptive (including diagnostic): what happened and why
- Predictive: what is likely to happen
- Prescriptive: what we should do now
1. Why this matters now
Gartner reported that more than 87 percent of organizations are classified as having low business intelligence and analytics maturity, even after years of investment in data and BI [1].
At the same time, Forrester’s work on insights driven businesses shows that companies which systematically harness data and insights grow at an average of more than 30 percent per year and are on track to take a very large share of revenue from less informed competitors [2].
So you have a clear gap:
- Most teams are still living in the “descriptive dashboards” world
- A smaller group is using analytics to look ahead and choose better moves
Understanding descriptive, predictive and prescriptive analytics is one of the fastest ways to move from “we have dashboards” to “we make better decisions, faster”.
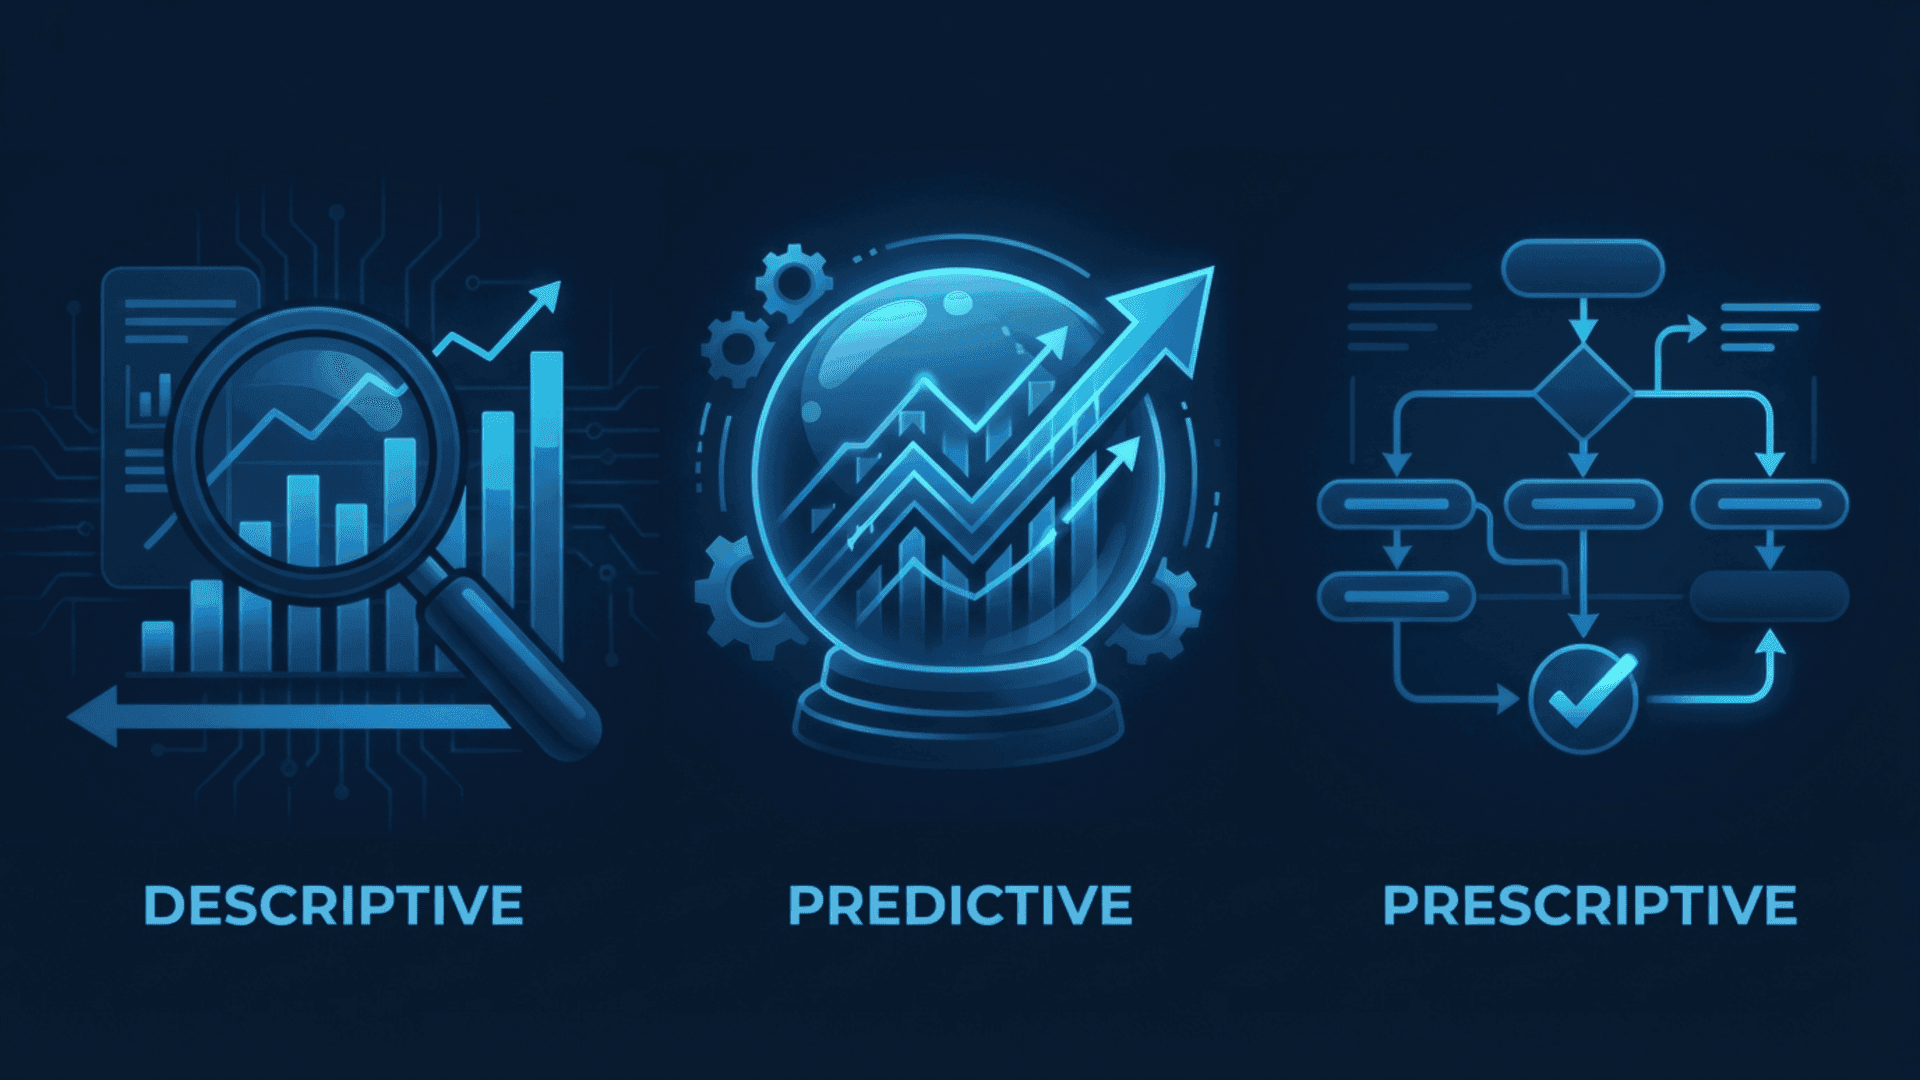
2. The three types in one minute
Here is the big picture before we go deeper.
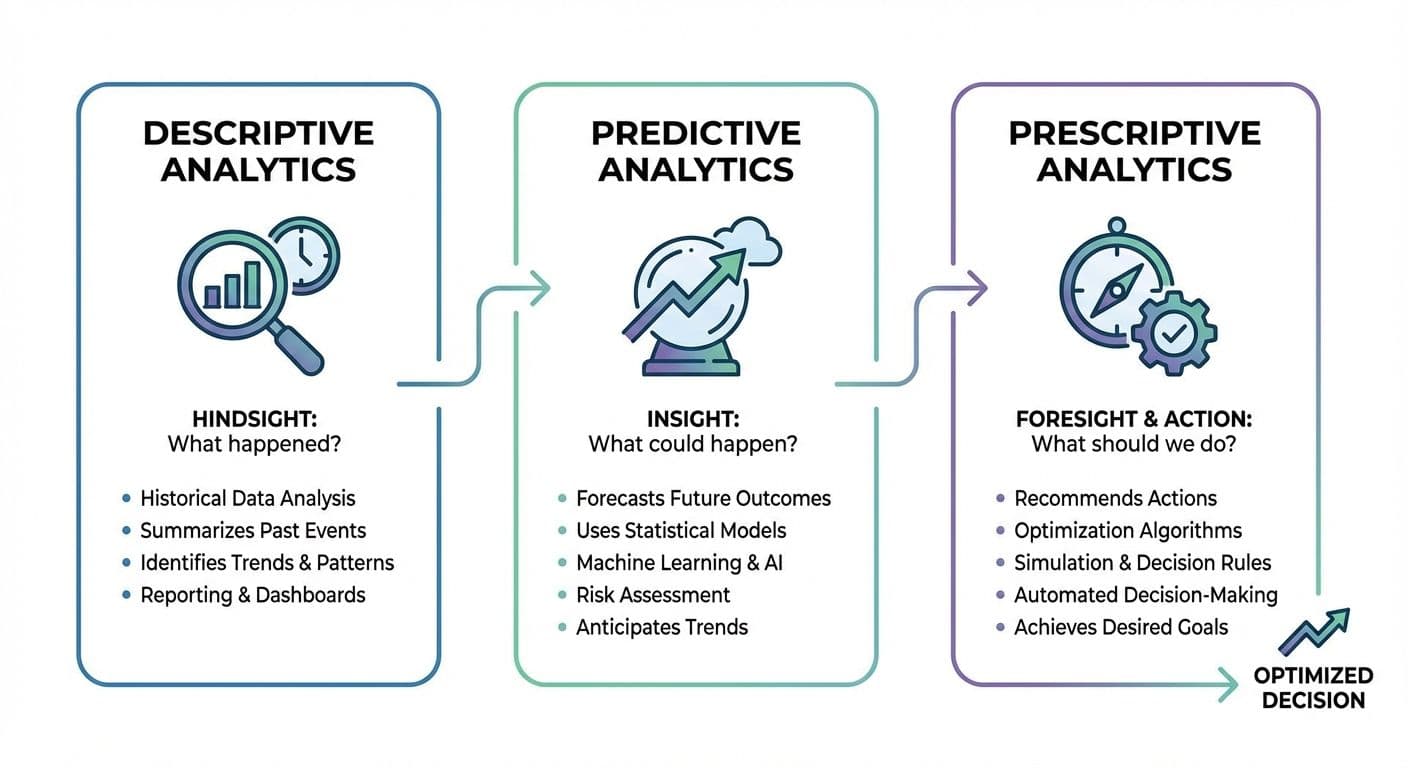
Think of them as lenses you use in sequence, not as competing tools.
3. Descriptive and diagnostic analytics - your operational rearview mirror -
Main question: What happened, and where or why did it happen?
Descriptive analytics summarizes and visualizes past data so you can see trends and patterns: revenue over time, funnel conversion, retention curves, win rates, campaign performance and operational metrics [3].
Diagnostic work is what you do once you see a spike or drop. You start asking “why” and drill down:
- Slice by country, device, campaign, segment
- Compare cohorts before and after a change
- Look at session recordings or sales notes for context
Together, they form your descriptive layer.
Typical data sources
Product and growth
- App or web events, feature usage, funnels, retention
Marketing
- Ad platform metrics, web analytics, email performance
Sales
- CRM stages, win or loss reasons, pipeline value
Finance and operations
- Billing, subscription status, support tickets, SLAs
Quick scenarios
Product
You ship a new onboarding flow. Descriptive analytics shows that activation dropped from 52 percent to 44 percent. Diagnostic work reveals the drop is concentrated on Android users coming from a specific ad network after a new screen was added.
Marketing and growth
Descriptive analytics shows customer acquisition cost is up 18 percent. Diagnostic work finds that one channel’s cost per click stayed stable, but its conversion rate fell after a landing page change.
Sales
Descriptive analytics shows win rate slipping. Diagnostic work reveals that deals involving a new competitor stall at the same stage because discovery questions are not adapted.
What decisions it informs
- Where performance is dropping or improving
- Which segments, journeys or campaigns need deeper analysis
- Which issues are surface level versus structural
If your descriptive layer is weak or untrusted, any predictive or prescriptive work will sit on shaky ground.
4. Predictive analytics - your forward radar -
Main question: What is likely to happen if we keep going as we are?
Predictive analytics uses historical data plus statistical or machine learning models to estimate future outcomes. Instead of asking only “What was churn last month?” you can ask “Which customers are likely to churn in the next 30 days?” or “What will next month’s demand look like?” [3].
Typical data sources
- All your descriptive data, at a more granular level
- Outcome labels
- Churned versus retained
- Converted versus did not convert
- Closed won versus closed lost
- Additional signals
- Engagement intensity and feature usage
- Segment, industry, region
- Support history, discounts, contract terms
High impact scenarios
Product: churn prediction
A model scores each account’s churn risk based on usage and support patterns.
Decisions this enables:
- Which accounts customer success should contact this week
- Which UX issues to prioritize
- Where to design retention experiments
Marketing and growth: LTV by channel
You forecast lifetime value for cohorts acquired through each channel using early behavior signals.
Decisions this enables:
- How to allocate budget
- Which campaigns to scale or pause
- What customer acquisition cost is sustainable
Sales: close probability
You estimate the probability that each opportunity will close in the next 30 or 60 days using deal size, stage, activity and buyer signals.
Decisions this enables:
- Which deals to focus on
- How realistic the revenue forecast is
- Whether hiring plans match likely revenue
Operations: demand forecasting
You predict demand by product, region and season.
Decisions this enables:
- Inventory levels
- Staffing and scheduling
- Supplier contracts and logistics capacity
How predictive analytics changes your questions
- From “What was churn?” to “What will churn be if we change nothing?”
- From “Which customers churned?” to “Who is at risk right now?”
- From “What was conversion by channel?” to “Where will the next 1000 high value customers come from?”
You still need judgment and context, but now you are steering with a view of the road ahead, not only the mirror.
5. Prescriptive analytics - turning insight into action -
Main question: Given our options and constraints, what should we do?
Prescriptive analytics takes predictions, combines them with rules, goals and constraints, and recommends specific actions. It links analytics directly to choices such as which experiment to run, which price to set, which campaign to fund, and which customer to contact and how [3].
Inputs
- Predictive scores and forecasts
- Business rules and policies
- Constraints such as budget, capacity, SLAs, pricing limits
- Objectives such as revenue, margin or retention targets
Methods
- Optimization models
- Scenario simulation
- Rule based decision engines that use predictive outputs
High impact scenarios
Product: roadmap and experiments
You score potential features or experiments by impact, effort and risk. Prescriptive logic recommends a set that maximizes expected retention or revenue within engineering capacity.
Marketing and growth: budget allocation
You take predicted ROAS or LTV per channel, minimum and maximum spend limits, and total budget. The system recommends a monthly split that maximizes expected revenue while staying within constraints.
Sales and customer success: next best action
For each account, a decision engine uses churn risk, expansion potential and engagement to suggest the next move, for example a quarterly business review, training session, expansion pitch or light touch.
At this stage you are not just asking “What will happen?” You are asking “Which combination of actions gives us the best outcome, given our reality?”
6. How it works together - one retention story -
Consider a mobile app that sees retention drop after a release.
1. Descriptive plus basic diagnostic
- Dashboards show 14 day retention falling from 28 percent to 23 percent
- Funnels highlight a spike in drop offs on one onboarding screen
- Segmenting by platform and campaign shows the issue is concentrated in one cohort
2. Deeper diagnostic work (still descriptive layer)
- The team compares cohorts before and after the release and reviews session recordings
- They discover that a new paywall appears earlier in the journey and blocks a popular free feature
3. Predictive analytics
- Analysts model three options: keep the paywall where it is, roll back to the old position or move it slightly later
- For each option they forecast churn, conversion and revenue over the next six months
4. Prescriptive analytics
- Taking into account quarterly revenue targets and limited engineering capacity, an optimization chooses the option that maximizes revenue while restoring retention
- The team codifies a rule for future launches, for example “Do not gate this feature before users reach event X unless an experiment shows no negative impact on 14 day retention”
Instead of a long debate based on opinions, the team has a structured way to see the trade offs and choose a move.
7. Quick self check and next steps
You can roughly place your team on the analytics maturity curve by asking three small sets of questions.
Descriptive layer
- Do we have clear, shared definitions of our core metrics?
- Can we see funnels, cohorts and retention for key journeys?
- Do most decisions reference shared dashboards rather than private spreadsheets?
If not, invest here first.
Predictive layer
- Do we have at least one working model for churn, LTV, close probability or demand?
- Do business teams actually see and use these predictions in their normal tools?
- Have we checked accuracy and tuned models based on real outcomes?
If not, choose one high value prediction and run a focused pilot.
Prescriptive layer
- For any recurring high stakes decision, do we use explicit rules or optimization, or mostly intuition?
- Are there decisions where we already have predictions but still allocate resources by habit?
If yes, that is a natural place to add simple prescriptive logic, even as basic as “if score is above X and value is above Y, then action Z within N days”.
In practice, many teams use decision intelligence or analytics platforms such as Optisas to bring these layers together in one workflow so that descriptive, predictive and prescriptive insights show up where business decisions are actually made. Whether you rely on a modern platform or spreadsheets plus SQL, the important part is that your decisions move along this maturity curve over time.
Summary
- Descriptive (including diagnostic) analytics tells you what happened and where or why it happened
- Predictive analytics tells you what is likely to happen next if you keep going as you are
- Prescriptive analytics tells you what you should do now, given your options and constraints
Most organizations already have the raw data. The leverage comes from using these three layers together so that every important decision moves from “we feel” to “we know the trade offs and we choose”.
Sources
[1] Gartner
[2] Forrester